8.1 Fine Mapping Overview
After carrying out an admixture scan, (say with the methods we have implemented in ANCESTRYMAP and described in [2]), it is essential to follow up in areas of the genome that have promising association scores. As the admixture peaks will be wide, containing perhaps 100 genes, the real biological pay-off will come from fine-mapping that is in identifying the actual variant in the region that causes disease risk. We sketch out a strategy for doing this in the very same samples initially used for admixture disease gene localization.
The strategy for fine-mapping follow-up is to genotype a large number of SNPs (more than 1,000) across the peak of admixture association, at a resolution of one every few thousand base pairs. In an analysis using African-American data, the goal is to identify a SNP that is in strong LD with the disease-causing variant in the African and/or European ancestral populations. This LD will be inherited in African Americans, and will permit the accurate localization of the disease gene to within a few tens of kilobases.
To be more specific, we note that in our published paper on admixture mapping methods [2], we introduced a log factor score for a given risk model, and locus. We review this scoring method for African Americans, which have experienced a history of admixture between European and African populations, though the methods are of course quite general. Assume for the moment that all model parameters, such as the average amount of European ancestry of each individual, and the allele frequencies of all markers in the parental populations are known exactly. Next, we assume a risk model, and locus, so that if an individual has a chromosomes of European ancestry at that locus, then the risk factor is ψ(a) = P (D|a)/P (D|0), where P (D) denotes the probability of disease. (Our notation allows European ancestry to be protective as well as more risky, so that ψ(a) < 1 if a > 0.) In [2] we showed that the log-factor L(i) for individual i, for our causal hypothesis against the null hypothesis that ψ(a) = 1 for each a is:
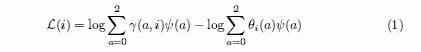
Here γ(a, i) is the probability that individual i has a European chromosomes at the locus, given all our observations, and θi (a) is the average ancestry for the individual. The overall log-factor for all the samples is then just the sum of the log-factors over all individuals.
We now show that we can extend our methods to form a score suitable for fine-scanning. In the above theory, if ancestry at a locus is known, then the alleles at the locus are irrelevant to disease risk. But this will not be the case if the marker is in LD with a risk allele, except in the extreme case that the allele is a perfect surrogate for ancestry. (In African Americans only one such example is known: the ‘Duffy’ null allele [1].)
Generalizing the above theory, we introduce a risk function ψ(a,b) for an individual with a European chromosomes and b variant alleles. Then we can generalize equation (1) in this case to:
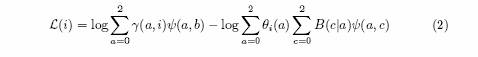
where b is the number of variant alleles actually carried and B(c|a) is the conditional probability of c variant alleles given a European chromosomes. It is easy to check that if the risk function ψ(a,c) is independent of c, then (2) reduces to (1) as it should. In practice ψ(a,c) is unknown to us. We next discuss the values of which values of ψ to try. As an ansatz, set
ψ(a,b) = eaλ ebμ
where we will now choose λ,µ. Fix µ for the moment and assume that the ancestry risk for one copy of a population 2 allele is r, and that r is known, or at least tightly estimated. In practice we are fine-mapping after an coarse scan ‘hit’ from ANCESTRYMAP so this is not unreasonable. Now it is easy to check that
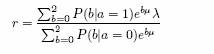
so that
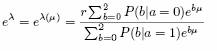
Setting µ = 0, yields the model in which only the ancestry is relevant, and not the genotype. Given this easy theory, we can now readily compute a logfactor F(µ) for a given hypothesis for the value of µ, against a null hypothesis that µ = 0. We in practice set µ on a mesh spaced uniformly on a log-scale and then factor-average. The strategy is then to see if a substantially larger Bayes factor can be found by allowing µ to be non-zero, indicating an additional effect of the SNP above and beyond the admixture association.
Suppose then that we have N mesh points both for µ,λ(µ) and if (λk, μk ) are the k-th λ, µ pairs we choose on the mesh, and F (k) is the Bayes factor we obtain for the k-th such pair, a natural score for the fine-mapped locus is![]() This is a likelihood ratio for the hypothesis that one of our mesh points is correct, against the null where µ = 0; that is, there is no contribution of the allele above and beyond the admixture association.
This is a likelihood ratio for the hypothesis that one of our mesh points is correct, against the null where µ = 0; that is, there is no contribution of the allele above and beyond the admixture association.
References
[1] M. Hamblin and A. Di Rienzo. Detection of the signature of natural selection in humans: Evidence from the Duffy blood group locus. American Journal of Human Genetics, 66:1699–1679, 2000.
[2] N. Patterson et al. Methods for high-density admixture mapping of disease genes. American Journal of Human Genetics, 74:979–1000, 2004.